Asset Performance Management
Analysis & Visualization for PI Systems
Analysis & Visualization
Proactive Performance Management Simplified
Gain deep insight into asset performance, without the complexity of custom configuration, using our proven PI System plugins that easily transform your PI System data into actionable insights.
PI Plugins: Performance Management
Plug in advanced performance management and analysis with our proven PI System plugins. Browse our extensive collection of Performance Management plugins below. You can filter and sort by industry. Can't find what you're looking for? Contact us.
- All
- Electricity
- Food & Beverage
- Life Sciences
- Oil & Gas
- Water
- General
- General
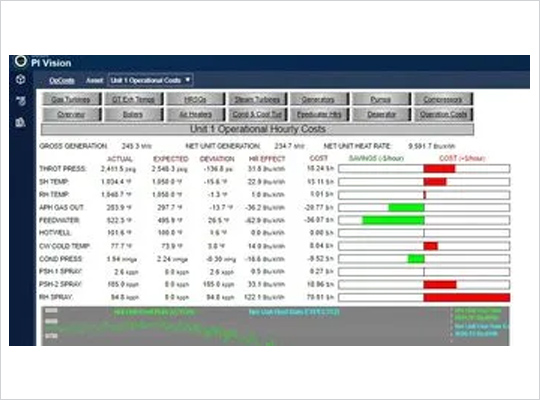
Combined Cycle Plant Operations Cost Analysis
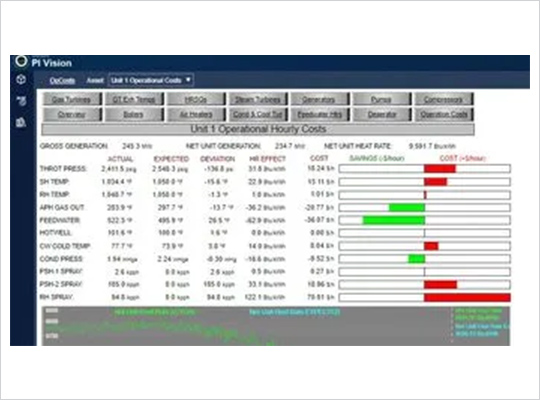
This PI System plugin identifies opportunities for immediate savings by comparing operational parameters to expected values. It calculates and displays the corresponding effects (in $/hour) on unit heat rate (or efficiency) and fuel costs/savings in real time. Operators can customize manufacturer design curves upon installation and can easily adjust them anytime afterward. Parameters include GT Inlet Filter Pressure Drop, GT Inlet Temperature, Compressor Section Efficiency and Cleanliness, Exhaust Temperature, HRSG Efficiency, and Condenser Pressure.

- Oil & Gas
Combined Cycle Plant Power Market Wise
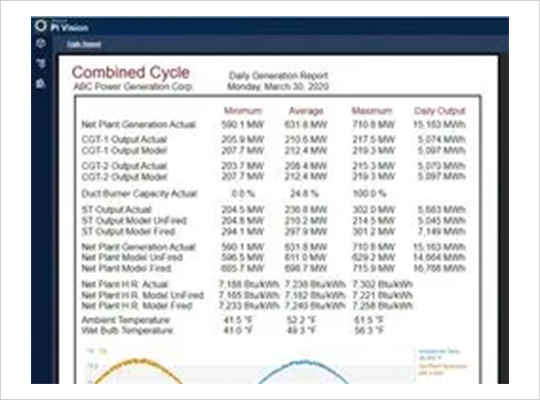
This PI System plugin provides a complete package for market based power plants to effectively manage their assets. Built entirely in AF with a web-based front end, the solution includes a weather-based capacity forecaster and a power purchase rules manager with daily and monthly invoicing capability. Operators or others can enter availability data and then provide real time feedback to power purchasers as an option.
- General
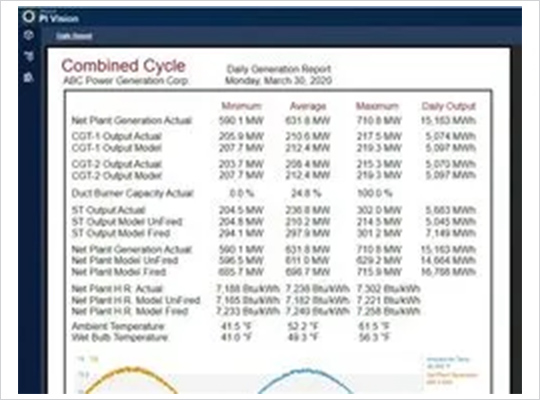
Combined Cycle Model - Weather-based Capacity Forecast
This PI System plugin reads weather forecast feeds and inserts hourly conditions into the model. Supported weather data feeds include weather.gov (U.S. 7-day by latitude/longitude) and visualcrossing.com (In Visual Crossing Weather, this information is available at the hourly and daily level. For forecast periods beyond 7-10 days, the forecast is run at three-hour intervals.) A separate AF database is used for a detailed plant model so users may include any parameter in the forecasted model. Users can also schedule automatic email distribution of reports at regular intervals (usually daily).
- General
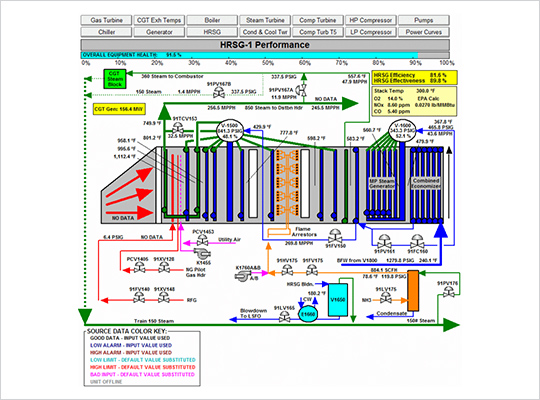
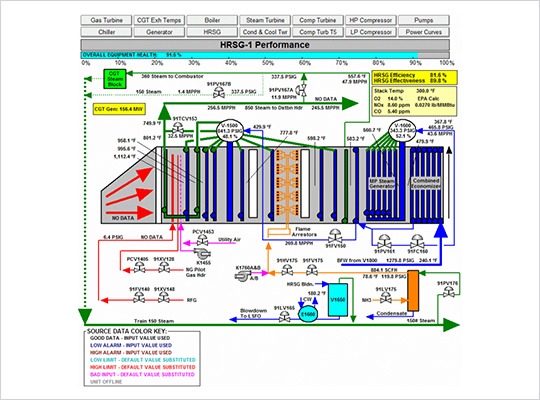
Heat Recovery Steam Generator Monitor
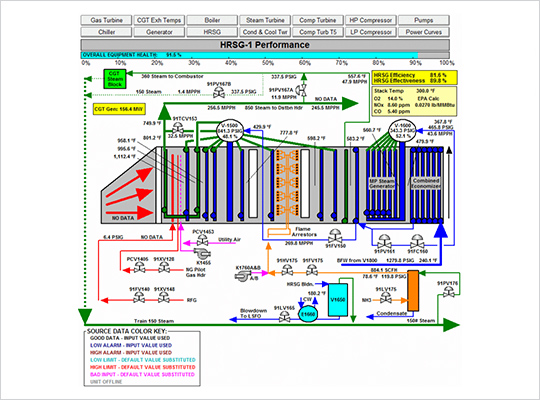
This PI System plugin is useful for identifying Heat Recovery Steam Generator (HRSG) integrity issues due to corrosion or other problems. It tracks and displays real-time HRSG efficiency and effectiveness metrics (HP and LP as applicable). NIST-JANAF tables are used to formulate flue gas enthalpies which are used to perform the necessary gas-side energy balances.

- Oil & Gas
Combustion Gas Turbine Air Filter Change Advisor
This PI System plugin uses financial modeling to determine the most economically advantageous time to replace the CT Compressor Air Inlet Filter. The advisor calculates this date/time using Maximum Net Profit Analysis.

- General
Combustion Gas Turbine Offline Wash Advisor
This PI System plugin provides a real-time calculation and polar plot of exhaust gas temperatures and maps to the originating combustion chamber. It uses the exhaust swirl angle to correct the combustion chamber position so that each exhaust thermocouple points to the correct combustion chamber. The visual map of the exhaust temperatures makes it easy to identify uneven temperatures distributions and determine the source combustion chamber associated with the given downstream thermocouples.

- General
Air-Cooled Condenser Fan Optimizer
This PI System plugin helps operators optimize ACC Fan configuration to minimize net heat rate for the unit or the entire plant. ACC Fan power consumption is considered in determining the optimal ACC Fan configuration for the real-time given conditions.

- General
Air-Cooled Condenser Condition Monitor
This PI System plugin module helps identify indications of problems with condenser operation or physical condition, which often have a substantial impact on plant heat rate. The plugin uses design specifications to predict target pressure (vacuum) and cleanliness for air-cooled condensers based on design specifications. These parameters are compared real-time to the corresponding actual conditions which are also calculated.

- General
Water-Cooled Condenser Condition Monitor
This PI System plugin module helps identify problems with condenser operations or physical condition that may have a substantial impact on the plant heat rate. The condenser model predicts pressure, temperature difference (TTD), and cleanliness. It compares these parameters in real-time to the corresponding actual conditions.
- General
Boiler Feed Pump Condition Monitor
This PI System plugin produces very useful graphics for early identification of boiler feed pump problems and performance degradation. The plugin features a PI Vision display and a daily operations report automatically delivered to your email inbox. Easily review calculations in your PI Asset Framework data – no hidden black box mysteries. The module’s real time calculations include driver/pump set efficiency, pump efficiency, performance factor, suction head, NPSH, discharge head, and total head. Pump head and efficiency are calculated and plotted against the expected curves respectively. Reference curves are scalable, dynamic, and adjust with pump speed as appropriate.
- Oil & Gas
Fuel Gas Orifice Metering Flowrate
This PI System plugin, based upon American Gas Association (AGA) report numbers 3 & 8, calculates gas compressibility (Z) and real time fuel gas flow. The calculation yields (1) Actual Compressibility, (2) Base Compressibility, (3) Mass Flowrate, (4) Actual Volumetric Flowrate, and (5) Standard Volumetric Flowrate.
- General
Generator Reactive Capability
This PI System plugin provides a very handy visualization of real time generator operation compared to the limitations. The unique real time display features a dynamic generator reactive capability curve. The D-curve is plotted with extreme accuracy using true polar coordinates so that the entire limit curve is displayed dynamically around the entire 180 degree plot. Hydrogen pressure (or temperature where applicable) D-curve accurately moves in real time with the actual hydrogen pressure (or temperature) and the reactive/real power is plotted within.
- Electricity
Real-Time Chiller Performance Monitor
This PI System plugin performs thermodynamic calculations on the chiller coils, calculating the real time chiller duty, heat exchanger effectiveness, and heat transfer coefficient. It uses the chiller design specs to model design conditions for real time comparison. Air moisture removal rate is calculated when inlet humidity is available. When used with the Combustion Gas Turbine Performance Monitor & Plant Heat Rates plugin, the chiller advisor will determine whether chiller operation is beneficial under current ambient conditions. When used with the Combustion Gas Turbine Weather-based Forecast plugin, the chiller advisor will recommend chiller operation based upon future ambient weather conditions.
- General
Combustion Gas Turbine Operations Cost Analysis
This PI System plugin is extremely valuable for identifying immediate opportunities for turbine operations cost savings. It compares operational parameters to expected values and the corresponding effects on unit heat rate (or efficiency) and fuel costs/saving. Parameters include GT Inlet Filter Pressure Drop, GT Inlet Temperature, Compressor Section Efficiency and Cleanliness, Exhaust Temperature. Operators can customize the manufacturer’s design curves upon installation and can easily adjust them anytime afterward.
- Electricity
Combustion Gas Turbine Weather Forecast
This PI System plugin reads weather forecast feeds and inserts hourly forecasted ambient conditions into tables to forecast combustion gas turbine capacity and heat rate using correction curves and historic performance data. Supported weather data feeds include weather.gov (U.S. 7-day by latitude/longitude) and wunderground.com (International 10-day by city name). Internet access is required for at least one associated computer for weather inputs. Operators can also schedule automatic email distribution of forecast reports at regular intervals (usually daily).
- Electricity
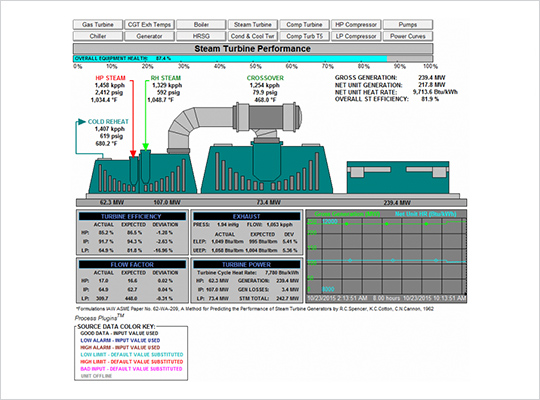
Steam Turbine Condition Monitor
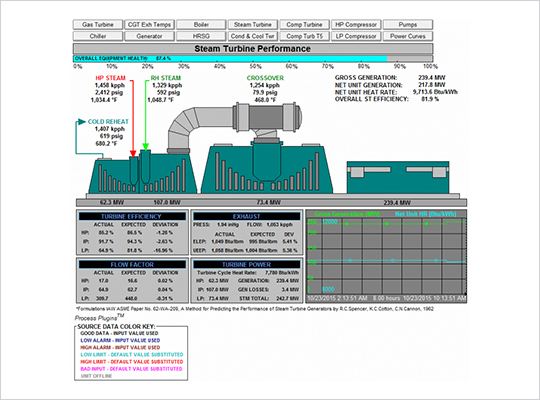
This PI System plugin module simplifies the identification of reductions in turbine efficiency and other turbine performance issues. It calculates actual and expected efficiencies of each individual steam turbine, steam power extracted from each individual turbine, and electrical and mechanical losses in real time. It also calculates and accounts for turbine leakages. Formulations are based upon ASME A Method for Predicting the Performance of Steam Turbine Generators (by R.C. Spencer, K.C. Cotton, C.N. Cannon). Calculations are in accordance with ASME PTC 6/6s and utilize properties of water and steam calculated in accordance with the ASME 1997 formulations.

- General
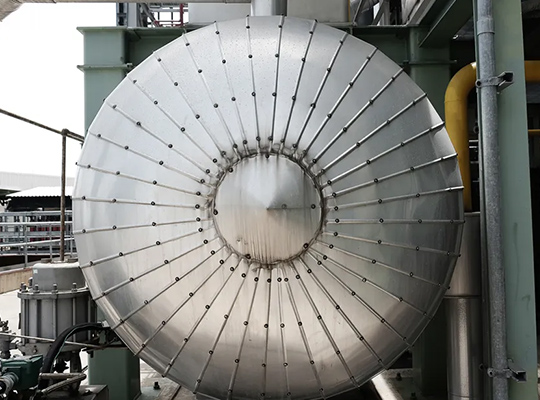
Rankine Plant Operations Cost Analysis
This PI System plugin module calculates real time financial losses or savings (in $/hour) based upon given operational parameters in comparison to the target values. It is extremely valuable in identifying opportunities for immediate savings. Operational parameters are compared to expected values and corresponding effects on unit heat rate (or efficiency) and corresponding fuel costs/savings are calculated real-time and displayed. Parameters include Main Steam Pressure and Temperature, Reheat Temperature, Condenser Pressure, Cooling Tower Outlet Temperature (when Cooling Tower Performance is included), Feedwater Temperature, Hotwell Temperature, Attemperation Spray Flows, and Auxiliary Station Service Power. Operators can customize the manufacturer’s design curves upon installation and can easily adjust them anytime afterward.
- General
Advanced Boiler Performance Monitor
This PI System plugin provides the gross turbine heat cycle rate based upon the boiler’s steam-side heat input to the turbine cycle. Efficiency is calculated by the loss method, which is the most accurate way of ultimately calculating real-time coal flow and net unit heat rate. Losses are calculated real-time (in accordance with ASME PTC 4.1) and compared to expected losses and overall boiler efficiency. Air heater exit gas temperature (corrected to zero leakage), gas side efficiency, and x-ratio are calculated and compared to expected real-time values. This solution includes a custom display of the boiler side view and air heater when the diagram is provided. Boiler Efficiencies (actual and expected) and Steam Temperatures are trended to provide a visual display of Boiler Key Performance Indicators.

- Electricity
Detailed Thermodynamic Modeling
This PI System plugin features a detailed plant model is built in a PI-AF database integrated with a customized interactive PI ProcessBook display. It allows the user to easily edit the value of any input parameter and view a new set of recalculated results stored in PI tags. The ProcessBook display includes a handy form to edit the input data. When opened, this form is automatically filled with actual plant values as the default, making it very handy to run the plant against real data with any number of edits to easily see “What If” any parameters are changed. The display includes a side-by-side real vs. model set of parameters, making it convenient to enter actual input values, and compare modeled to actual values and any parameter may be included in the model input/output display. This is handy when tuning the model as is often needed to account for equipment degradation.

- Electricity
Water-Cooled Condenser CW Pump Optimizer
This PI System plugin module provides real-time optimal Circulating Pump configuration in order to minimize the net heat rate for the unit or the entire plant. This tool requires the Condenser Performance package to determine the effects of various pump configurations on condenser pressure, and resultant effects on turbine cycle heat rate. Circ water pump power consumption is considered in determining the optimal CW pump configuration for the real-time given conditions.

- Electricity
Feedwater Heater Condition Monitor
This PI System plugin helps identify problems with the feedwater heater’s operation or physical condition by comparing differences in expected versus actual results. The plugin models and predicts feedwater outlet temperature, terminal temperature difference (TTD), drain cooler approach (DCA), and steam extraction flow for feedwater heaters. It also calculates actual conditions and compares them in real time to the predicted values.

- Electricity
Adaptive Emissions Optimizer for Coal Boilers
This PI System plugin for tracking coal boiler emissions is an ideal retrofit for meeting the Cross State EPA emissions program requirements. It offers an adaptive optimal supervisory Oxygen controller(1) for fossil fired boilers and will typically increase thermal efficiency of the boiler by more than one percent with corresponding reduction in heat rate and emissions. The system is optimized for pulverized coal combustion. The controller uses multiple O2 and CO sensors (optional NOx) located in the economizer section of the boiler. The system automatically finds the “knee” of CO versus O2 curve representing the current combustion characteristics (state curve) and can be easily configured for any size boiler with multiple CO (NOx) and O2 sensors.

- Electricity
Deaerator Condition Monitor
This PI System plugin monitors the deaerator to predict the feedwater outlet temperature, terminal temperature difference (TTD), and steam extraction flow. By comparing the expected results to calculations for the corresponding actual conditions, it highlights differences that could indicate problems with the deaerator operation or physical condition.

- Electricity
Boiler Cleanliness Monitor
This PI System plugin models each section of a boiler and calculates the overall heat transfer coefficient in real time. Each section’s cleanliness is calculated in real time and displayed in a bar chart.

- Electricity
Wind Turbine Site Capacity Forecast
This plugin predicts wind turbine generator capacity based on weather conditions based on weather forecast feeds from weather.gov (U.S. 7-day by latitude/longitude) and wunderground.com (International 10-day by city name). During installation, you can customize the expected value calculations with manufacturer curves or historical data or easily adjust them later. Note: at least one computer associated with the plugin requires internet access for retrieving weather inputs.

- Electricity
Solar String Condition Monitor
Assess and capture your DC to AC “performance ratio” by monitoring output vs. ambient light irradiance. This solution monitors the condition and performance of the module DC output, axis trackers, string inverters, and transformers. It creates a real-time plot of output power and current vs. DC voltage rendered with available design curves. PI Notifications provide email alerts in the event of a performance reduction or any discernable condition requiring attention.

- Electricity
Solar Park Capacity Forecast
This plugin uses a separate Asset Framework database to create a model for photovoltaic power stations. It regularly reads weather forecast feeds from weather.gov (U.S. 7-day by latitude/longitude) and wunderground.com (International 10-day by city name) and inserts hourly forecasted ambient conditions into the model. The plugin automatically generates and distributes a forecasted model report which can include any parameter. Most users select a daily distribution schedule, but configuring a custom schedule is easy. Note: at least one computer associated with the plugin requires internet access for retrieving weather inputs.

- General
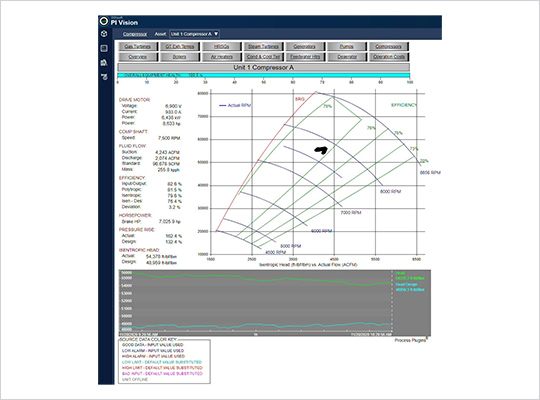
Liquid Ring Compressor Condition Monitor
This plugin helps identify liquid ring compressor issues early. It calculates compressor stages, overall pressure ratios, free air delivery (FAD), brake horsepower and both isothermal efficiency and volumetric efficiency metrics in real time then plots the values against reference curves. Each compression stage is analyzed independently for multi-stage compressors. The visualization graphic makes it easy to compare real-time performance with the reference curves to quickly identify performance degradation.
- General
Centrifugal Compressor Condition Monitor
This tool makes it easy to identify compressor problems early. It calculates discharge pressure, work (brake horsepower), and both isentropic efficiency and polytropic efficiency then plots them against scalable, dynamic reference curves that adjust with compressor speed. The visualization graphic makes it easy to compare real-time performance with the reference curves to quickly identify performance issues.

- Electricity
Wind Turbine Condition Monitor
This plugin compares real-time turbine performance to expected performance. It monitors turbine status for gear boxes, generators, and overall performance issues and organizes wind asset parameters by Region, Site, Turbine, and Component within the PI Asset Framework. The master display supports five levels of drill down featuring Executive, Regional, Site, Turbine, and Component screens.

- General
Fan Condition Monitor
This plugin quickly identifies issues with fan performance. It calculates fluid power, driver/fan set efficiency, blower efficiency, and total pressure then plots them in real time against scalable, dynamic reference curves that adjust with fan speed. The visualization graphic makes it easy to see deviations from the expected values and identify problems early.

- Water
Blower Condition Monitor
This plugin makes it easy to identify problems with blowers. It calculates fluid power, driver/fan set efficiency, blower efficiency, and total pressure then plots them in real time against scalable, dynamic reference curves that adjust with blower speed. The visual display highlights variances from the reference curves for efficient performance degradation identification.

- Oil & Gas
Expansion Turbine Condition Monitor
This plugin helps quickly identify potential problems with rotating equipment. It uses gas inlet and outlet conditions to calculate the power extracted by the turbo-expander, applicable efficiencies, and shaft losses. The Centrifugal Compression Monitor (PPI-GNL-CCR-PRF) provides the calculations for the applicable shaft load. The software plots the real-time performance indicators against the corresponding design curves. The visual display highlights variances for efficient problem identification.

- General
Turbine-Driven Compressor Condition Monitor
This plugin simplifies early identification of problems with turbine driven compressors. It calculates compressor discharge pressure, work (brake horsepower, and both include isentropic efficiency and polytropic efficiency then plots them plots them in real time against scalable, dynamic reference curves that adjust with compressor speed. It also includes condition monitoring data from the driving turbine: Combustion Turbine Condition Monitor or Steam Turbine Condition Monitor as appropriate. The visual display highlights variances from the reference curves for efficient performance degradation identification.

- Electricity
Combustion Gas Turbine Power Curves
This plugin compares Corrected Power to Air Inlet Temperature and plots power against the Full Load Output design as well as PCD and WF curves. It displays all other pertinent KPIs and the trend for corrected and predicted power.

- Electricity
Combustion Gas Turbine Power Curves (using KPIs)
This variation of the Combustion Gas Turbine Power Curves plugin allows users to customize the plugin with their own existing KPI tags.

- Oil & Gas
Auxiliary Boiler Performance Monitor
This PI System plugin delivers substantial insight into auxiliary boiler performance. It calculates boiler losses in real time in accordance with ASME PTC 4.1 then compares them to expected losses and overall efficiency. It also calculates air heater exit gas temperature (corrected to zero leakage), gas side efficiency, and x-ratio then plots them against expected values. The visualization features a custom side view diagram of the boiler and visual trends for steam temperatures and both actual and expected efficiencies.

- Electricity
Biomass Boiler Performance Monitor
This plugin calculates boiler efficiency in real time and compares it to expected boiler efficiency based on historical data.

- General
Boiler Efficiency and Performance Monitor
This plugin delivers substantial insight into boiler performance. It calculates boiler losses in real time in accordance with ASME PTC 4.1 then compares them to expected losses and overall efficiency. It also calculates air heater exit gas temperature (corrected to zero leakage), gas side efficiency, and x-ratio then plots them against expected values. The visualization features a custom side view diagram of the boiler and air heater and visual trends for steam temperatures and both actual and expected boiler efficiencies.

- General
Heat Fuel Gas Heater Condition Monitor
This plugin performs thermodynamic calculations on the fuel gas heater, calculating the real-time duty, heat exchanger effectiveness, heat transfer coefficient, and fluid flows. Design specs model the design conditions for real-time comparison of actual and expected fuel temperatures. Capacity and heat rate impacts of the combustion gas turbine generator are calculated and incorporated into the Combustion Gas Turbine Performance Monitor plugin.

- Electricity
Turbine Compressed Air Cooler Condition Monitor
This plugin performs thermodynamic calculations on the TCA (Turbine Compressed Air) cooler, calculating the real-time duty, heat exchanger effectiveness, heat transfer coefficient, and fluid flows. Design specs model the design conditions for real-time comparison of actual and expected TCA temperatures.

- Oil & Gas
Heat Exchanger Condition Monitor
This plugin performs thermodynamic calculations on the heat exchanger tubes/fins/coils, calculating the real-time duty, heat exchanger effectiveness, heat transfer coefficient, and fluid flows, as appropriate. The heat exchanger design specs model the design conditions for real-time comparison.

- Electricity
Coking Battery and Oven Monitor and Totalizer
This solution calculates and totalizes key parameters of the coking batteries and ovens. Calculations include, but are not limited to daily, (today and yesterday), weekly, monthly, and yearly NTE (not to exceed) event counters of high and low temperatures, damper positions, charge weights and control limits, feed rates, and emissions.

- General
Reciprocating Engine Driver Condition Monitor
This module provides real-time actual vs. expected power output capacity and actual vs. expected efficiency based upon manufacturer specifications. This information can detect early machine performance problems. A user can easily adjust customizable curves any time after installation. Expected values calculations require the availability of appropriate curves (from the manufacturer or actual historical data).

- General
Drum Chemistry Monitor
This plugin plots real-time chemistry indications including pH vs phosphate and silica and cation conductivity vs. drum pressure against expected curves. Reference curves are scalable and dynamic where appropriate. PI Notifications provide email alerts to any anomaly in chemistry requiring attention.

- General
Pulp Line Condition Monitor
This plugin monitors the performance of the pulp line by comparing real-time drive motor power, water consumption, and chemical and bleaching agent consumption to design and/or expected historical values.

- Water
Reverse Osmosis/Desalination Plant Monitor
This plugin monitors the performance of the Reverse Osmosis/desalination plant. It analyzes fresh water production, chemical consumption and energy consumption to provide real-time indication of plant performance compared to design values. This solution also includes real-time mass balance reconciliation of supply water, fresh water, and wastewater. The Process Plugins Reverse Osmosis/Desalination Plant Monitor includes visualization of these real-time performance indicators via PI-Vision and Reports.

- Water
Distillation/Evaporation/Desalination Plant Monitor
This plugin monitors the performance of the distillation/evaporation/desalination plant. It analyzes freshwater production and energy consumption to provide real-time indication of plant performance compared to design values. This solution also includes real-time mass balance reconciliation of supply water, fresh water, and wastewater.
- Electricity
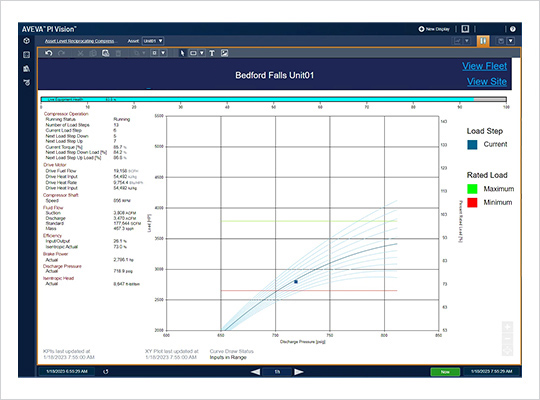
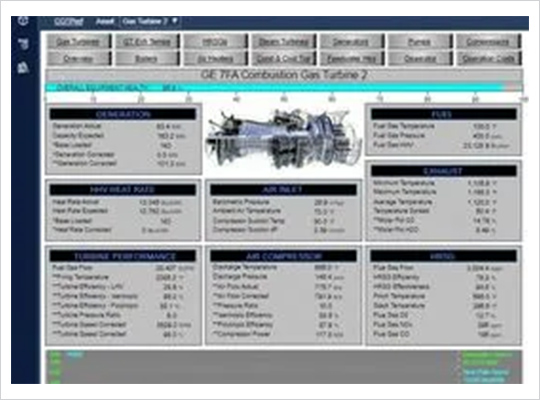
Reciprocating Compressor Visualization and Analytics
This PI System plugin makes it easy to add advanced monitoring and alerting for reciprocating compressors to your PI Vision displays. Calculate easy-to-read overall health score metrics. Compare current asset performance with manufacturer specific methodologies, tables, and curves. Replace irksome number tables with clearly plotted charts and graphs for monitoring displays. Identify and alert on unsafe operating patterns. Provide early warnings for slow trend variances from optimal norms. Maximize asset utilization, extends asset life, and avoids downtime.
- Electricity
Gas Turbine Performance Monitor & Plant Heat Rates
This PI System plugin module provides real-time compressor efficiencies, expected generator capacity, and expected heat rates based upon compressor inlet temperature and humidity. This information can be useful in determining loss of turbine efficiency or other problems. Curves are customizable and can be easily adjusted anytime afterward. Expected values calculations require the availability of appropriate curves (from the manufacturer or actual historical data). The tool makes it easy to identify problems with turbine performance early. It also provides corrected load and heat rate at base load which provides the best indication of turbine condition since all environmental factors are removed and turbine performance is measured at the same base conditions at all times so any step change in the performance is easily detected.

- Electricity
Reciprocating Engine Generator Performance Monitor & Plant Heat Rates
This plugin helps with early detection of generator efficiency loss and other problems. It compares real-time generator capacity and heat rates to expected values from manufacturer curves or actual historical data. Curves are customizable and can be easily adjusted at any time.

- Electricity
Combustion Gas Turbine Exhaust Temperature Profile
This plugin helps your operations team quickly identify emerging issues with your turbine’s performance. It uses the exhaust swirl angle to accurately map and display each thermocouple’s origin, so it’s easy to pinpoint exactly which combustion chamber is responsible for any given downstream thermocouples. Our intuitive visual map of the exhaust temperatures for your PI Vision display makes it easy to identify uneven temperatures distributions and determine the source combustion chamber associated with the given downstream thermocouples.

- Electricity
Transmission & Distribution Losses
This plugin calculates real-time electrical losses throughout the Transmission and Distribution system across all transformers and transmission lines from the source generators to the substations. Indication of power must be available for each substation (step-down transformers to distribution network) as well as the power (megawatts) supplied by each generator on the grid.

- Electricity
Coal Flue Path Emissions & EPA Calculations
This PI System plugin provides all applicable emissions calculations from the Environmental Protection Agency (EPA) 40 CFR Part 60 (Code of Federal Regulations) per the revision of July 1, 1993. Also included are any provided calculations necessary to accommodate state, local, or international government regulations. This customization may include totalizing in defined time-blocks as required. The solution includes performance monitoring of all major flue gas path equipment including (where applicable) wet and dry scrubber and atomizer, spray dryer absorber (SDA), NOx selective catalytic reducer (SCR/SNCR), electrostatic precipitator, and baghouse. It also includes a real time display of flue gas path with all available temperatures, pressures, and emission gas concentrations.
- Oil & Gas
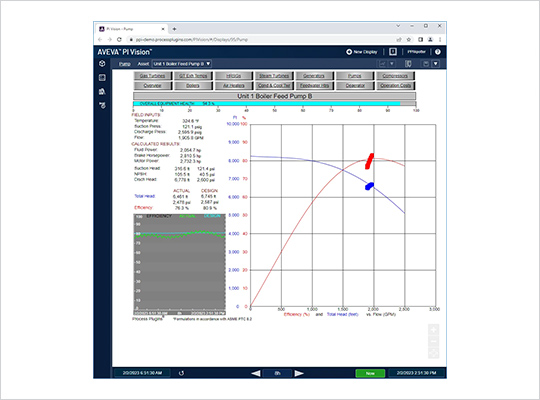
Pump Condition Monitor
This plugin helps you detect any potential issues before they arise so your pumps can keep running smoothly. With this powerful tool, it’s easy to identify pumping system problems early with fast and accurate calculations for pump efficiency, driver/pump set efficiency, performance factors, suction head, NPSH, discharge head, and total head metrics. Plus our visualization graphic makes it simple to compare real-time performance with reference curves at a glance – allowing you to act quickly if necessary! Don’t let unexpected downtime ruin your production schedule. Get reliable at-a-glance insights from the Pump Condition Monitor PI System Plugin today as well as increased safety and uptime thanks to faster detection of any abnormalities in pump conditions or performances.
- Oil & Gas | Electricity
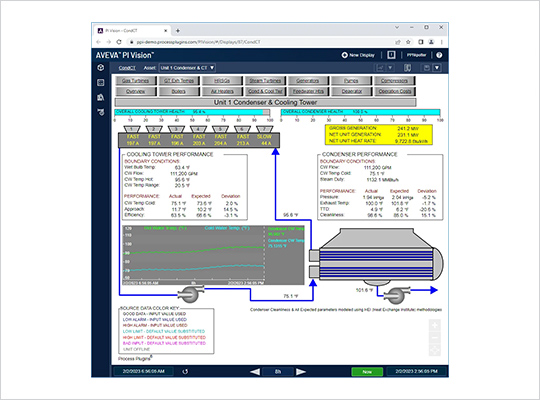
Cooling Tower Condition Monitor
This plugin provides operators with detailed information to identify any problems with the operation or physical conditions of your cooling towers. Operators can customize curves based on manufacturer or actual historical data during installation and adjust them easily anytime afterward. It calculates the real-time actual and expected cooling tower outlet temperature based upon wet bulb temperature and range (circ-water temperature rise). Easily track condenser performance boundary conditions like CW flow, steam duty, pressure, cleanliness, and exhaust temperature. With this plugin, you don’t have to worry about mechanical components developing degraded performance even when fans run at peak load only for short periods. Enjoy greater control over your facilities by optimizing safety and process performance through easy monitoring of critical parameters in real time with our advanced data visualization solutions tailored specifically for cooling tower operation.

- Oil & Gas
Heat Exchanger Condition Monitor
This plugin performs thermodynamic calculations on the heat exchanger tubes/fins/coils, calculating the real-time duty, heat exchanger effectiveness, heat transfer coefficient, and fluid flows, as appropriate. The heat exchanger design specs model the design conditions for real-time comparison.

- General
PI-AI Connector
The PI-AI Connector transfers the heavy processing demands of Artificial Intelligence (AI) and Machine Learning (ML) training from your PI server to the powerful InfluxDB time-series database. By harnessing this robust and cost-effective engine, the PI-AI Connector ensures seamless and consistent replication of your PI data, keeping your operational data stores in PI unaffected and running smoothly for AI/ML training or intensive Predictive Analytics processing.
Contact
Have questions?
We have answers.
Do you have a Digital Transformation initiative? Need to upgrade your automation and controls systems? Wondering how you can become more data-driven? Let's talk.


